Python for Data Analytics in Ranchi: Beginner to Job-Ready
New to coding? Learn Python for Data Analytics with this beginner and guide from Emancipation, covering Pandas, NumPy, EDA, and real-world data skills.
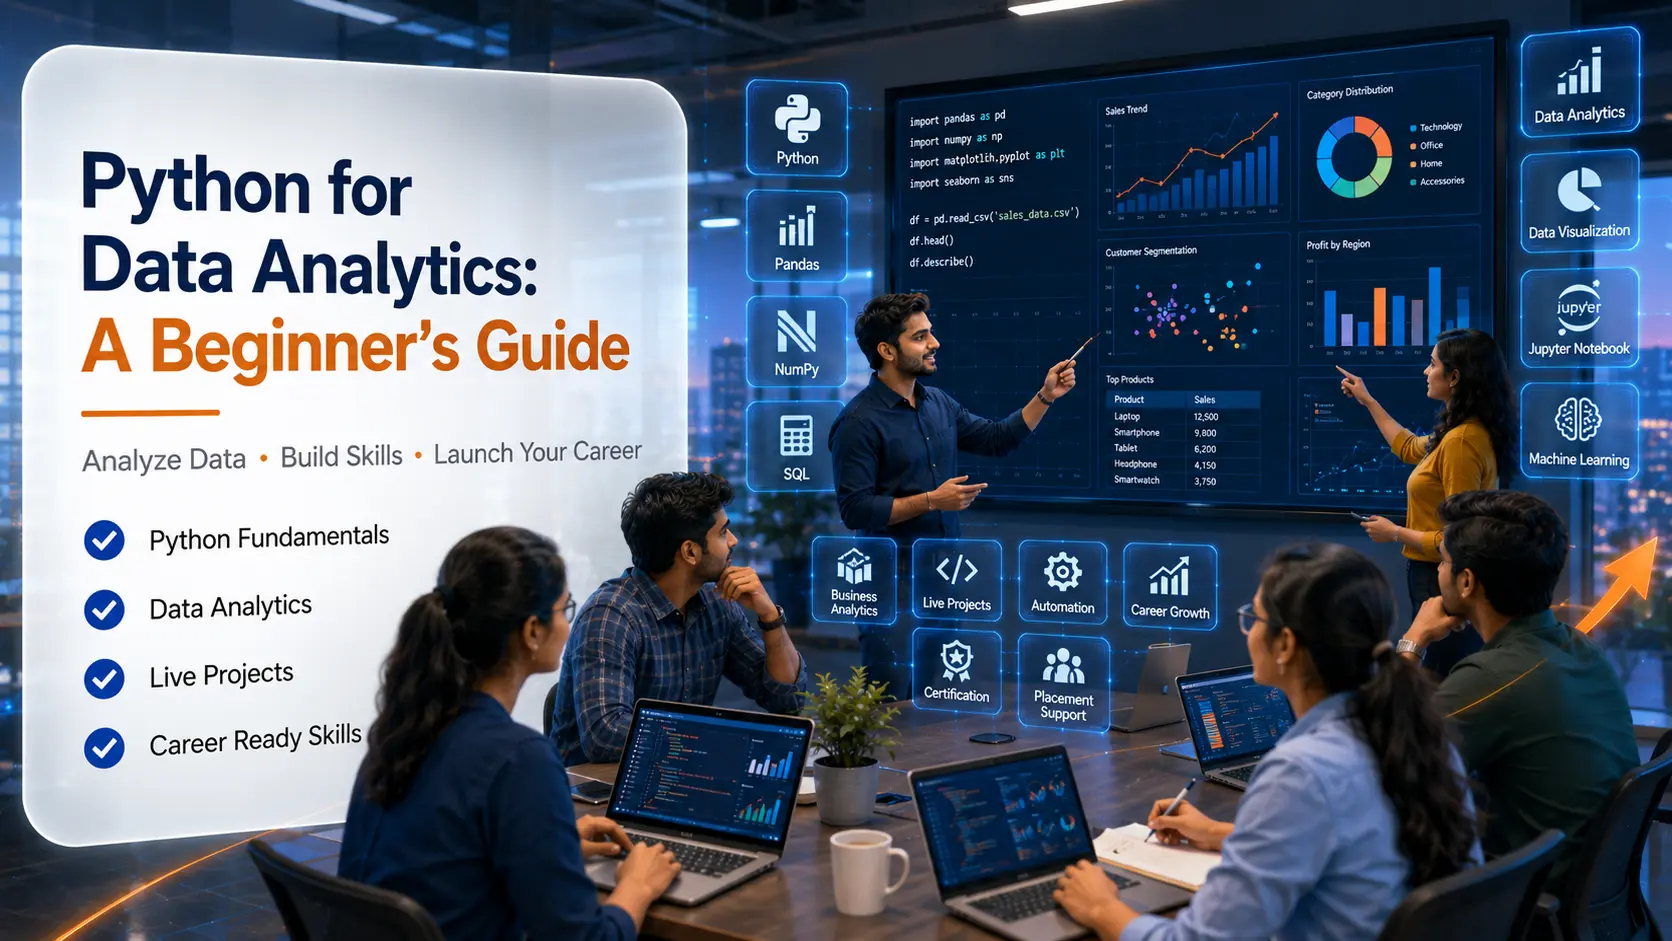
If you have ever wondered how companies make sense of massive amounts of data, the answer very often involves Python for Data Analytics. At Emancipation, we regularly guide students, freshers, and working professionals who are just beginning their journey into data-driven careers, and Python remains the most recommended starting point. This guide is written specifically for Python for Data Analytics beginners who want a clear, practical roadmap rather than scattered information.
By the end of this article, you will understand why Python is so widely used in analytics, which tools you need to learn, and how a structured learning path can take you from zero to job-ready.
Why Python for Data Analytics Is the Preferred Choice
Python has become the industry standard for data analysis because it balances simplicity with power. Unlike many programming languages that require heavy syntax knowledge, Python programming is beginner-friendly, readable, and supported by a massive global community.
For data-driven decision making, businesses need tools that can handle everything from data cleaning to visualization in one place. Python offers exactly that, which is why it consistently appears at the top of every Python for Data Science discussion across the industry.
Python vs Excel for Data Analytics
A common question we hear from beginners is: "Excel vs Python — which one should I learn?" The honest answer is that both have their place.
Excel works well for smaller datasets, quick calculations, and basic reporting
Python is better suited for large datasets, automation, repeated analysis, and advanced visualization
Many professionals eventually use both, but Python becomes essential as data complexity grows
If you already use Excel for data analytics, learning Python is a natural next step rather than a replacement.
H2: Getting Started — Python Data Analytics Tutorial for Beginners
For anyone completely new to coding, the first step is understanding basic Python programming for data analytics before jumping into specialised libraries. At Emancipation, our Python Training in Ranchi program follows exactly this structured approach.
Step 1 — Learn Python Fundamentals
Before touching any analytics library, beginners should be comfortable with:
Variables, data types, and loops
Functions and basic logic building
Working with lists, dictionaries, and file handling
This foundational stage is often covered under Python for beginners modules, and rushing past it usually creates confusion later when working with real datasets.
Step 2 — Set Up Your Environment with Jupyter Notebook
Most professional Python data analysts use Jupyter Notebook because it allows code, output, and visualizations to appear together in one interactive document. This makes it easier to experiment with data step-by-step, which is especially helpful during the learning phase.
Core Python Libraries for Data Analytics
Once fundamentals are clear, the real journey into Data Analytics using Python begins with a set of essential libraries. This is the stage where most learners start seeing practical results.
NumPy for Numerical Computing
NumPy is typically the first library learners explore, as it handles numerical operations and array-based calculations efficiently. It forms the backbone for most other data analytics libraries in Python.
Pandas for Data Manipulation
Pandas is arguably the most important library in any Python Data Analytics Course, used extensively for:
Data cleaning and handling missing values
Data manipulation through filtering, sorting, and grouping
Reading and processing files such as CSV and Excel sheets
Almost every real-world analytics project begins with Pandas, making it a non-negotiable skill for beginners.
Matplotlib and Seaborn for Data Visualization
Numbers alone rarely tell a complete story, which is why data visualization matters so much. Matplotlib provides the foundation for creating charts and graphs, while Seaborn builds on it with more visually appealing statistical plots. Together, they help analysts communicate insights clearly to non-technical stakeholders.
Understanding Exploratory Data Analysis (EDA)
Exploratory Data Analysis (EDA) is one of the most important stages in any analytics workflow. It involves examining datasets to understand patterns, detect anomalies, and form initial hypotheses before deeper analysis.
Typical EDA Steps for Beginners
Checking dataset structure and data types
Identifying missing or duplicate values
Visualizing distributions and relationships between variables
Summarising key statistics to guide further analysis
Learning EDA properly is often what separates a basic Learn Python for Data Analysis course from one that prepares you for actual industry work.
Introduction to SQL for Data Analytics
While Python handles most analytical tasks, many real-world roles also require SQL for data analytics, especially when working with structured databases. Emancipation recommends learning basic SQL alongside Python, as most companies expect analysts to pull data directly from databases before analysing it in Python.
From Data Analytics to Machine Learning Basics
Once you are comfortable with Python-based analytics, many learners naturally progress toward machine learning basics. Concepts such as regression, classification, and clustering build directly on the data manipulation and visualization skills gained earlier.
If this interests you, our Machine Learning Course in Ranchi page (linked internally on our website) explains how this natural progression works for students moving from analytics into predictive modelling.
Real-World Applications — Business Analytics with Python
Business analytics is one of the most common career destinations for those learning Python-based data skills. Organisations use Python to:
Analyse sales trends and customer behaviour
Automate repetitive reporting tasks
Build dashboards for management decision-making
Support data-driven decision making across departments
This practical relevance is exactly why Python Data Analytics Course enrolments have grown steadily among both freshers and working professionals in Ranchi.
Building Real Analytics Projects
Theory alone rarely leads to job readiness. At Emancipation, we emphasise analytics projects as a core part of learning, because employers consistently prioritise practical exposure over certificates alone.
H3: Beginner-Friendly Project Ideas
Sales data analysis using Pandas and Matplotlib
Customer segmentation using basic clustering
Survey data cleaning and visualization
Automating monthly report generation with Python scripts
These projects not only reinforce learning but also become valuable portfolio pieces during job interviews.
Automation — An Underrated Benefit of Python
Beyond analytics, Python is widely used for automation of repetitive tasks such as data entry, file handling, and report generation. For working professionals, this alone can justify learning Python, as it saves significant manual effort in day-to-day operations.
Python Training in Ranchi — Learning the Right Way
For learners based in Jharkhand, choosing a structured, locally accessible program matters. Emancipation's Python Training in Ranchi combines fundamentals, libraries, EDA, and real projects into one cohesive path, rather than teaching isolated topics.
We also offer a dedicated Data Analytics Course in Ranchi, designed for those who want to specialise further after learning Python basics. For learners who prefer instructor-led classroom training, our Python Classes in Ranchi and broader Computer Training Institute in Ranchi programs provide flexible options based on experience level.
H3: Who Should Learn Python for Data Analytics?
College students preparing for analytics or data science careers
Freshers seeking their first job in the analytics domain
Working professionals in finance, marketing, or operations looking to upskill
Career switchers moving from non-technical backgrounds into data roles
Individuals exploring our Advanced Python Course after completing basics
Choosing the Best Python Institute in Ranchi
When evaluating the Best Python Institute in Ranchi, learners should look beyond just syllabus coverage. Practical training, project-based learning, doubt-clearing support, and career guidance matter just as much as the course content itself.
Emancipation's approach focuses on building genuine analytical thinking, not just memorising library functions — an important distinction for anyone serious about a long-term career in data analytics.
Conclusion
Python for Data Analytics is one of the most valuable skills you can learn today, whether you are a student planning your career, a fresher entering the job market, or a working professional aiming to upskill. From Python fundamentals to Pandas, NumPy, visualization, and real analytics projects, the learning path is clear and achievable with the right guidance.
If you are ready to begin, explore Emancipation's Python Training in Ranchi and Data Analytics Course in Ranchi programs designed specifically for beginners and career switchers alike.

Frequently Asked Questions Python for Data Analytics
Is Python good for beginners in data analytics?
Yes, Python is widely considered one of the easiest programming languages for beginners due to its simple syntax and strong community support.
Do I need coding experience to learn Python for data analytics?
No prior coding experience is required; most beginner-friendly courses start from Python fundamentals before moving to analytics libraries.
Which Python libraries are essential for data analytics?
The core libraries include Pandas, NumPy, Matplotlib, and Seaborn, along with Jupyter Notebook for interactive coding.
Is Python better than Excel for data analytics?
Python is better for large datasets, automation, and advanced analysis, while Excel remains useful for smaller, quick calculations.
How long does it take to learn Python for data analytics?
Most beginners can gain working proficiency in 2 to 4 months with consistent practice and structured guidance.
Do I need to learn SQL along with Python for data analytics?
Yes, basic SQL knowledge is highly recommended since many analytics roles require pulling data directly from databases.
Can Python for data analytics lead to a career in machine learning?
Yes, Python-based data analytics skills form a strong foundation for progressing into machine learning and predictive modelling.
Is Python Training in Ranchi available for working professionals?
Yes, Emancipation offers flexible batch timings suitable for working professionals alongside students and freshers.
What kind of projects will I build while learning Python for data analytics?
Beginners typically build projects like sales data analysis, customer segmentation, and automated reporting scripts.
Is a Python Data Analytics Course worth it for freshers?
Yes, it significantly improves job readiness by combining technical skills with practical, project-based experience valued by employers.